 Do not worry, this is not some political post about my fear of war with any countries. Nope, this is a baseball post.
Everyone knows what WAR is when it comes to baseball statistics, right? Wins Above Replacement. I am not going to dive into it too much. There are tons of articles out there that explain it much better than I ever could. It basically tries to take players and measure how important they are to their team (the actual numbers incorporate runs, but then you can calculate how many runs created will equal a win…again, it is very complex, the Baseball Reference explanation is like 20,000,000 words long). The part people usually get hung up on is the replacement. They seem to think that means if you brought up someone from the minors (and they will then say “yeah, but what if that guy they bring up is the next great player?”). That is not what they are doing here. The replacement player is based on the league averages (again, it is all very complex). So I think that is a quick, confusing primer for WAR, still with me? Cool.
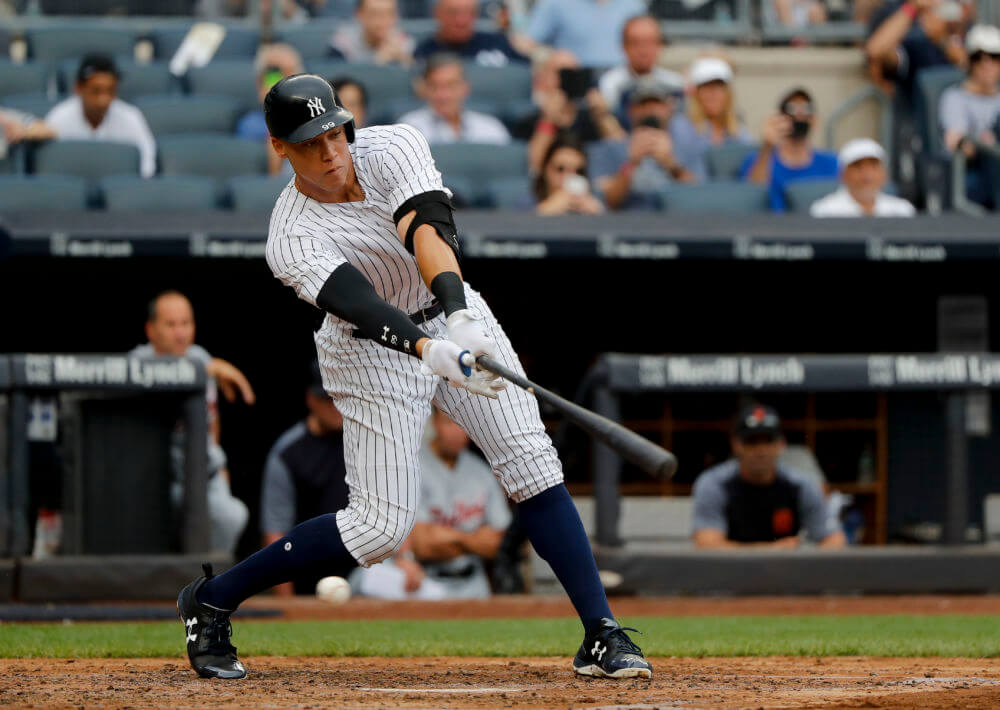
Recently during a discussion with Ryan and Offord, I brought up how great Albert Pujols 2009 season was (I think we were talking about how bad our predictions were back then, but how hilarious the comments were) and then we started talking about how few strikeouts he had. We compared it to Bryce Harper’s 2015 season, which was a higher WAR, but his Ks were more than double Pujols. I asked those guys if they thought that power hitters who do not strikeout often was a dying thing. We started looking at great historical players and noticed something…very few strikeouts. As Ryan put it, back in those days it was taboo to strikeout, you always wanted to move the runner over or be productive in some way. The next thought was that maybe OBP was worse back then because they would be making contact more, but probably getting on base less. However, a quick look at league OBP each year, does not show that, in fact, it may have been slightly higher.
One of the things I noticed that it was not until the late 1960s do you see guys striking out well over 150 times. In 1927, Babe Ruth led the league with 89 Ks. Now there are multiple factors that account for it: level of talent (the elite hitters were insanely better than the average pitcher, whereas today that gap is not nearly as wide), less pitches (did Ruth and those guys have pitchers throwing 4-seam, 2-seam, Cutters, sinkers, split-finger…that is just variations of fastballs), mindset of players (always make contact back then…), and use of pitchers (less rest, no specialized relievers, etc).
Okay, so I get that the different eras had different approaches to the game. I wanted to know how the sabermetric community dealt with that issue. Turns out that they do not put too much stock into hitters striking out. There are a variety of reasons. One is that it does not matter how you make an out, strikeout or groundout, the end result is the same. Or they will argue that in the grand scheme of things, sacrificing contact for power will generally create more runs and that is acceptable. So what I noticed is that none of the WAR stats (each site has their own version) includes strikeouts. I found that to be weird. Here is why…
From their own perspective, outs are the currency of baseball. You get 27 per game. You do not want to waste them, right? Now, there is also something called the Three True Outcomes. These are things that the hitter can control: a walk, home run, or strikeout. Anything else can be subjected to some luck. For example, Andrew McCutchen hits a line drive towards the second baseman. It travels 10 feet off the ground, the Cubs have Javier Baez playing second base, he is 6’0″ and jumps up to make a great catch. However, if they are playing the Astros, Jose Altuve (5’6″) may not be able to jump high enough and snag it, the ball travels into the gap and Cutch ends up with a double. Did McCutchen do anything different? Nope, in one circumstance he has a double, the other an out. He was unlucky in one situation that Baez is tall and can jump. This is where BABIP comes into play (batting average of balls in play). If you take out the three outcomes, what are you left with? Lots of balls hit where there is a chance for an out or not.
This is what bothers me. Sabermetrics says that basically making contact with the ball gives you about a 30% of reaching base. Striking out gives you an almost 0% chance (minus that extremely rare situation where there is a pass ball on a K and the runner is safe at first). So why do they not factor in strikeouts as opposed to these other outs that are made based mostly on luck/chance? When you look at some of the factors that go into a stat like WAR, you will see double plays factored in (I guess that would be the worst thing a hitter could do…okay, a triple play is the worst, but those are so rare). Well wouldn’t the next worst thing be a strikeout? Here are two stat lines:
Player 1:
47 HR, 124 R, 135 RBI, 16 SB, .327 AVG, .443 OBP, 1.101 OPS, 115 BB, 64 K
Player 2:
42 HR, 118 R, 99 RBI, 6 SB, .330 AVG, .460 OBP, 1.009 OPS, 124 BB, 131 K
Which player do you think had the higher WAR? If you said Player 2, you would be right. Player 1 is Albert Pujols 2009, while Player 2 is Bryce Harper 2015. Now WAR does take into consideration position, which it will weight Harper’s position and that production a little better. However, Pujols is not rewarded for striking out just 64 times. Pedro Alvarez had 64 strikeouts in 2013 by the beginning of June.
As of right now, there are 31 players with 30+ HRs and only four of them have less than 100 Ks (Joey Votto, Mike Moustakas, Anthony Rizzo, and Francisco Lindor). I looked at some random years back in the olden days.
YEAR–HR/K
1961–13/9
1970–19/10
1987–28/13
1995–21/11
2000–47/22
Hell, of the guys with 400 PAs right now, there are like 80 with less than a hundred Ks. You mean to tell me it is better to have everyone striking out? I just do not buy it. If the sabermetric community is correct, more home runs hit by the league should mean more runs, right? Well, here are the HR ranks from 2000-2017 (obviously this season is still going).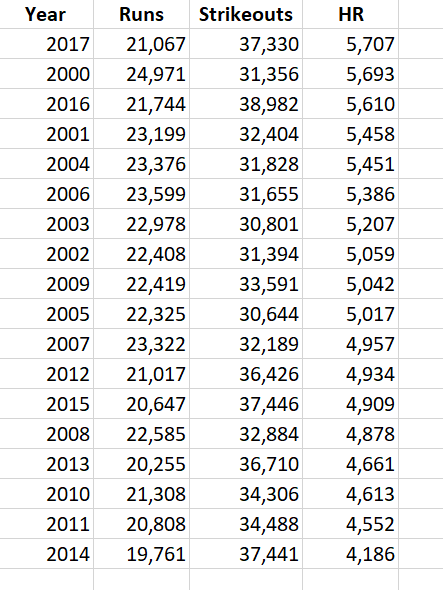
Notice anything? The most HR years are not always the ones with the most runs. In fact, look at 2016. 5,610 HR, but 38,982 Ks…that led to only 21,744 runs scored. It just seems to make sense to me that if you strikeout, you have less chances to score runs. Maybe I am crazy in my thinking.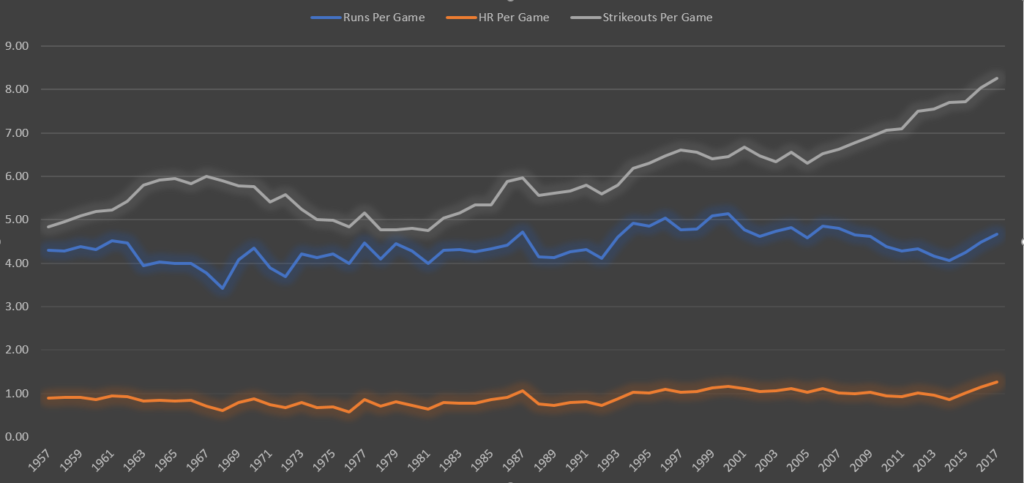
So I decided to get a little weird and look at all the seasons from 1957 to now. However, I realized that there would be some differences in number of teams over the years, so I decided to take the rates: Runs per game, HRs per game, and Ks per game. Strikeouts per game has been increasing pretty steadily since the early 1980s (yes there always exceptions). Home runs seem to stay pretty consistent. Here is something cool that I noticed…from the 1970s to the 1990s, the runs increase or decrease about the same as the strikeouts. And then if you look down to the home runs, there seems to be slight uptick or decrease to go with that year. By about 1995 and definitely the years after, you start to see the Ks and Runs diverging a good bit. Honestly, not 100% sure what this means. I guess back in the 1970-1990ish time, there was a sweet spot of strikeouts-to-home runs-to-runs. That was probably the magical time that people think of when they say “striking out more allows players to swing for more power and thus score more runs.” Whereas, it looks like from 2000 onward that hitters must have thought “well striking out is not as big of a deal, since it helps score runs.” Unfortunately…if everyone is striking out and the home run rate is only increasing a small bit, the runs are going to dip because no one is on base when a HR is hit.
I guess what I am trying to say is that hitters need to get back to that sweet spot of power and patience. Yep, it is that simple. I have no clue why some team does not hire me right away to be the general manager. And maybe someone needs to adjust WAR to take strikeouts into consideration…
Good write-up. I love on the line graph how for awhile there (until 2015) strikeouts continued to climb while runs were bottoming out. You sucky hitters.
I also need to admit that every time I see Jose Altuve, I think of you. Your photos look very Altuve’ish.
Haha, I have no clue how I should feel about that…